The chart below shows the growth* of the national debt of the United States from 1929 through the end of the 2023 fiscal year (September 30, 2023).
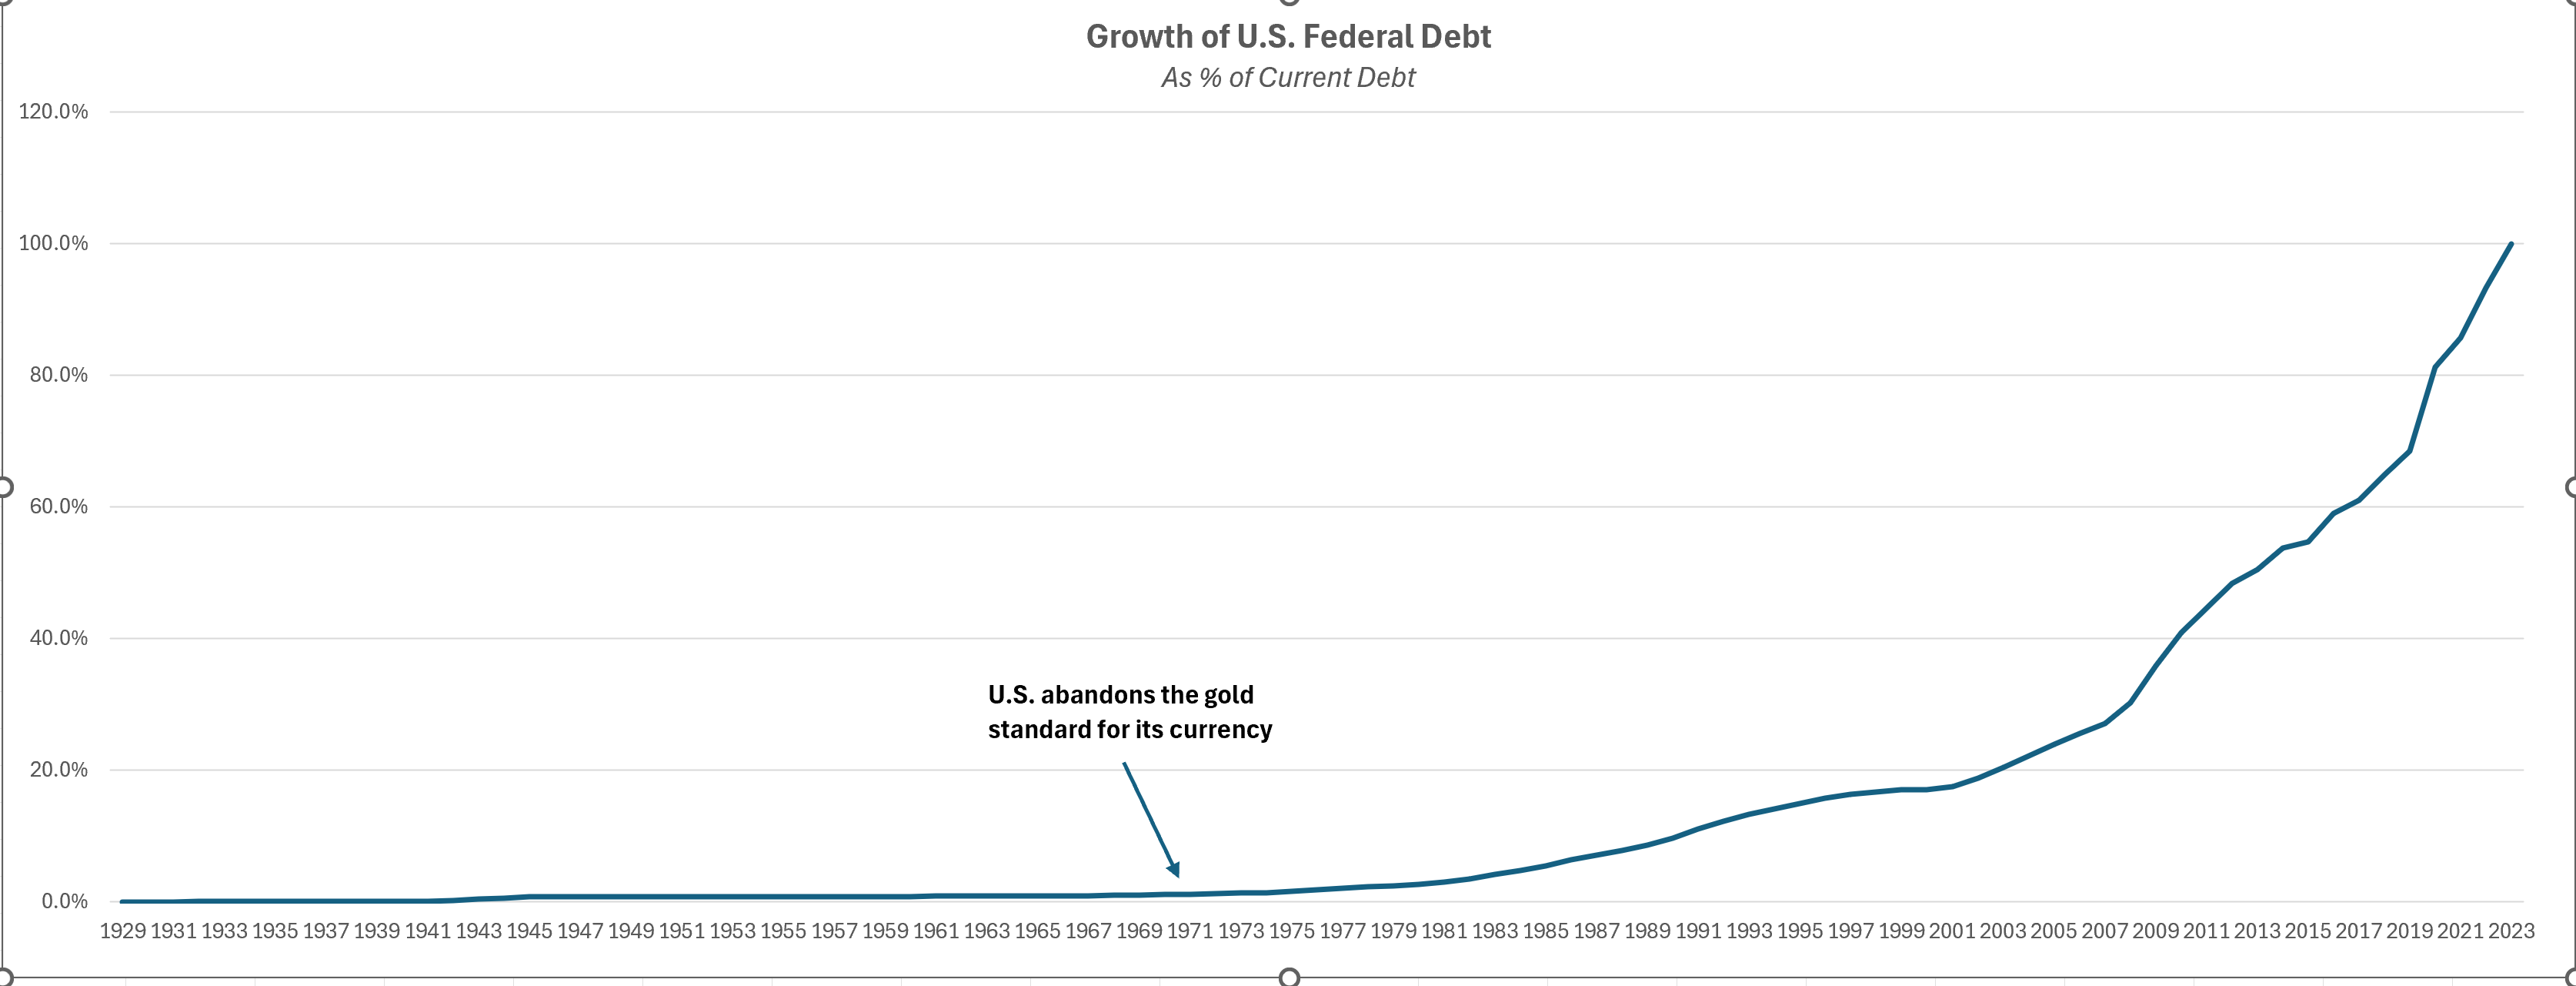
As shown, U.S. debt was relatively flat until 1971, the year the U.S. abandoned the gold standard. Shortly thereafter, U.S. debt levels began slowly creeping up, gaining serious momentum through the 1980s, 1990s and 2000s. In 2008, the year of the financial crisis, the U.S. adopted ZIRP, or “zero interest rate policy”, a policy designed to provide liquidity to an economy on the verge of financial collapse. ZIRP allowed the U.S. government to run ever bigger deficits, knowing the debt issued to cover those deficits would be virtually interest-free and purchased with freshly-printed money from the U.S. Treasury. Thus, it should be no surprise that 70% of total U.S. debt has been issued since the 2008 financial crisis.
In Ernest Hemingway’s book, The Sun Also Rises, two characters, Bill Gorton and Mike Campbell, have a conversation:
“How did you go bankrupt?” Bill asked.
“Two ways,” Mike said. “Gradually and then suddenly.”
By untethering the U.S. dollar from any tangible value, the U.S. has been on the road to bankruptcy, at first gradually and then suddenly.
_____________________________________________________________________
* – NB: The growth displayed is a function of the debt level at the end of the most current fiscal year of $33.17 trillion. Each year’s debt total is a percentage of $33.17 trillion. For example, U.S. debt for the year 2015 was $18.15 trillion and is shown on the chart as 55% (i.e., $18.15 / $33.17). Further, the U.S. debt for 2023 is shown as 100% ($33.17 / $33.17).